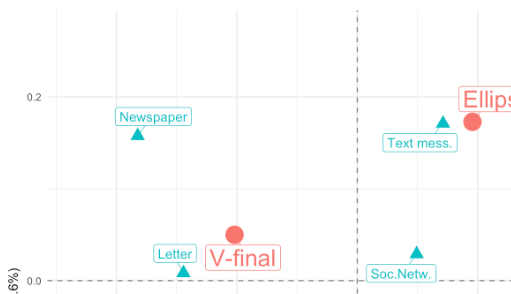
What we want to do Recently, I used a correspondence analysis from the ca package in a paper. All of the figures in the paper were done with ggplot. So, I wanted the visualization for the correspondence analysis to match the style of the other figures. The standard plot method plot.ca() however, produces base graphics plots. So, I had to create the ggplot visualization myself. Actually, I don’t know if there are any packages that take a ca object (created by the ca package) and produce ggplots from it.
What I will show you In this post, I want to show you a few ways how you can save your datasets in R. Maybe, this seems like a dumb question to you. But after giving quite a few R courses mainly - but not only - for R beginners, I came to acknowledge that the answer to this question is not obvious and the different possibilites can be confusing.
Maybe you already heard of the package “scales” - and if you didn’t hear about it, you might have used it without knowing (e.g., in the context of ggplot2 graphs). I want to show you a few of the functionalities of the “scales” package. I will also show you how to create your own scales. There are several possible reasons why you might want to use these:
Automatically create axis labels that show percentages (0.
After a long time of running my blog on blogger.com, I finally wanted to move it to a solution that’s better suited for the kind of contents I am posting. Namely, that’s content related to R and everything you can do with it - from analyzing large datasets to technical details or benchmarking stuff.
For me, it sounds really logical to blog about R with R (with the help of RStudio).