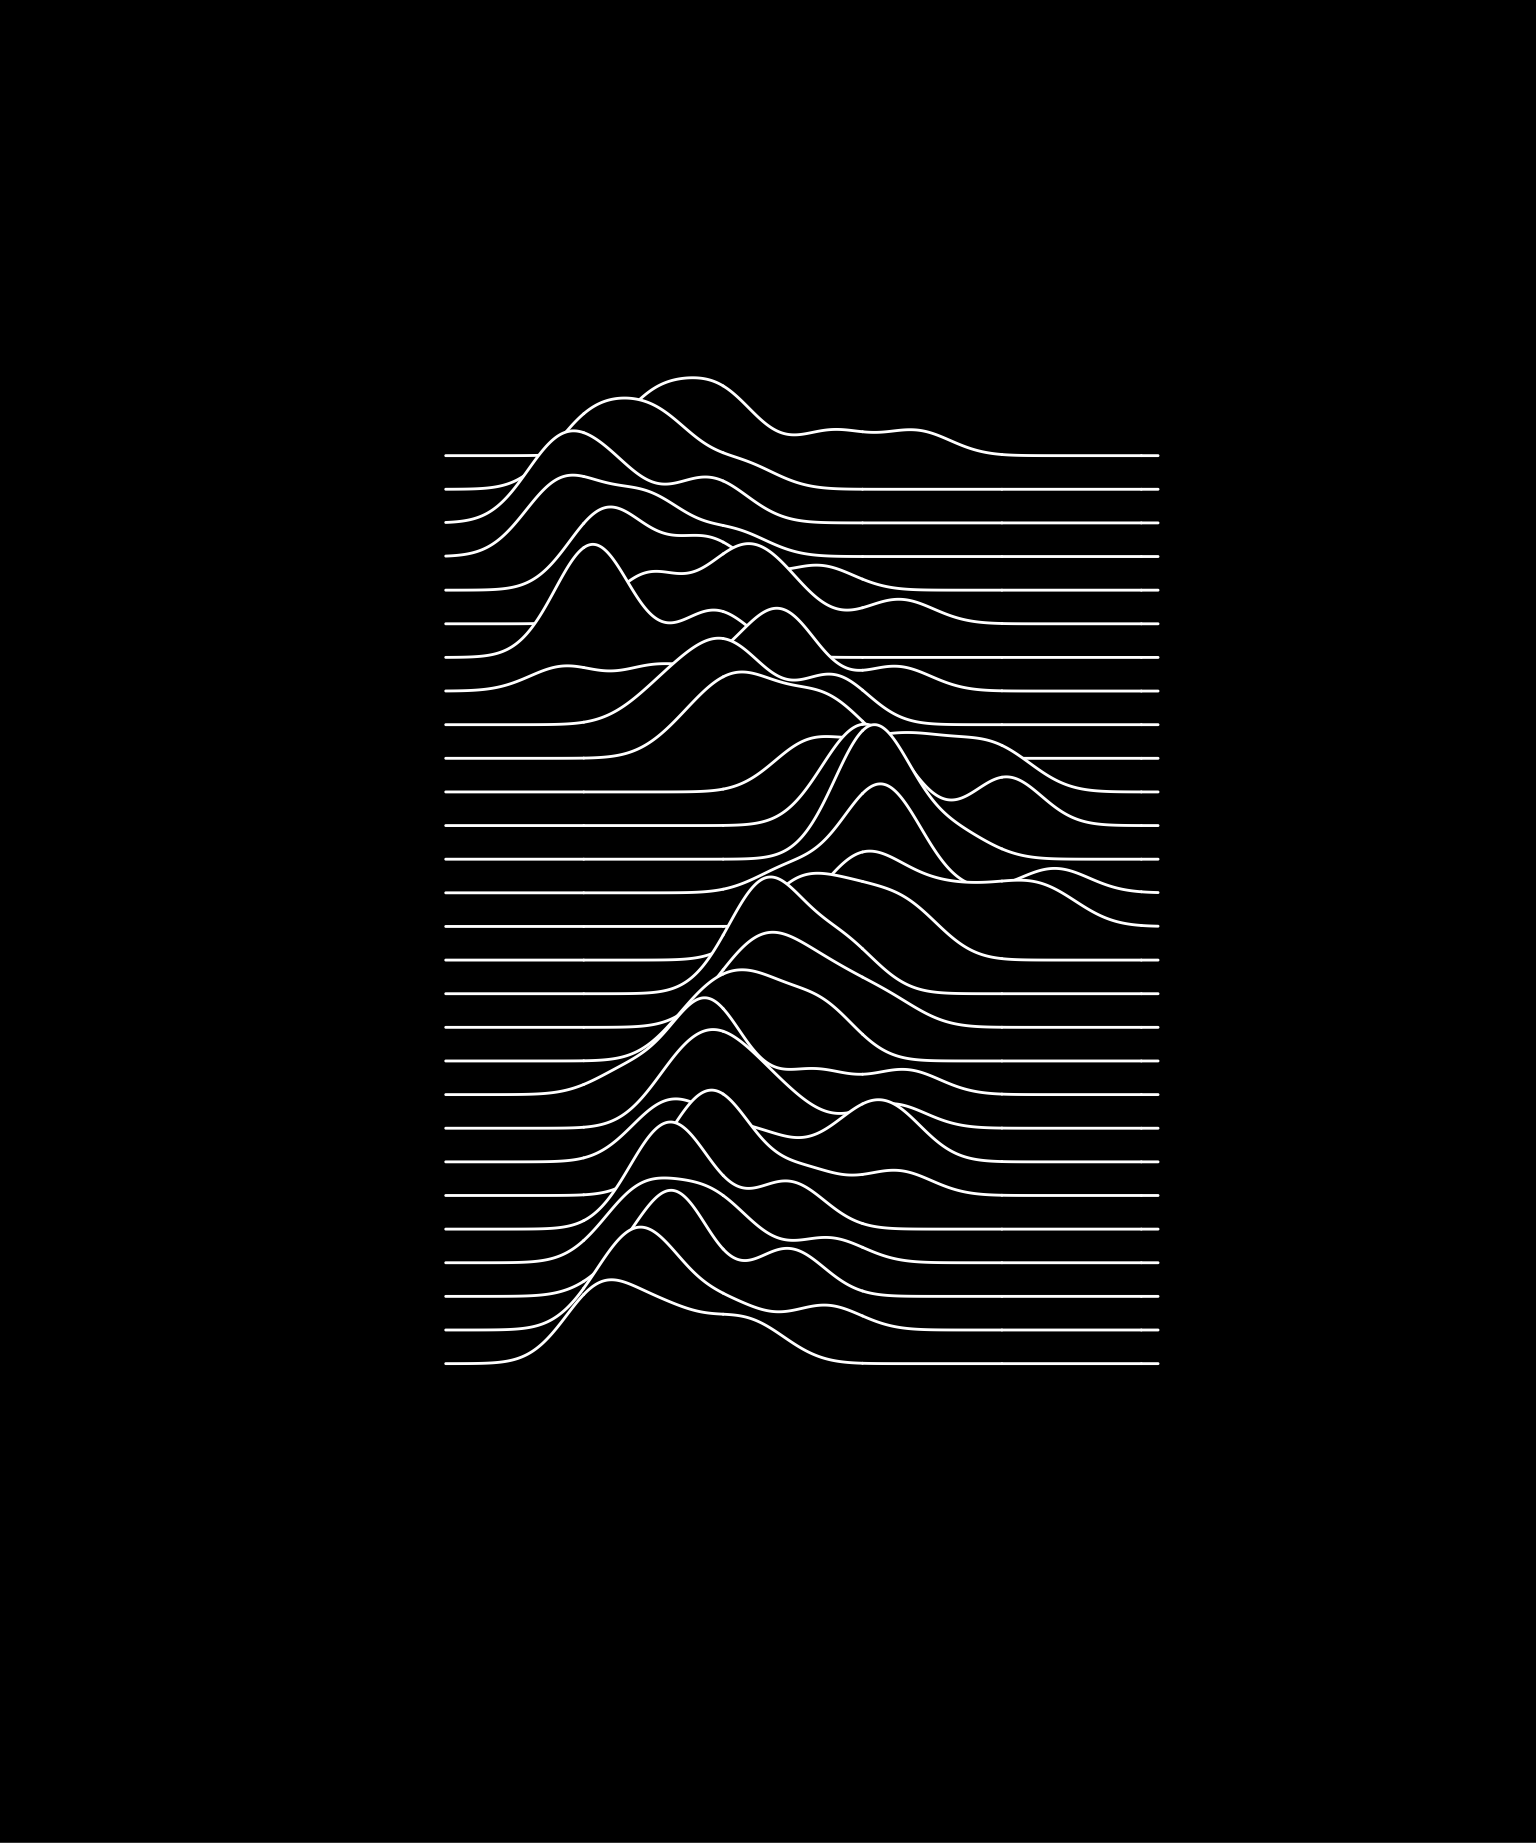
Let the snail crawl: Animated density curves
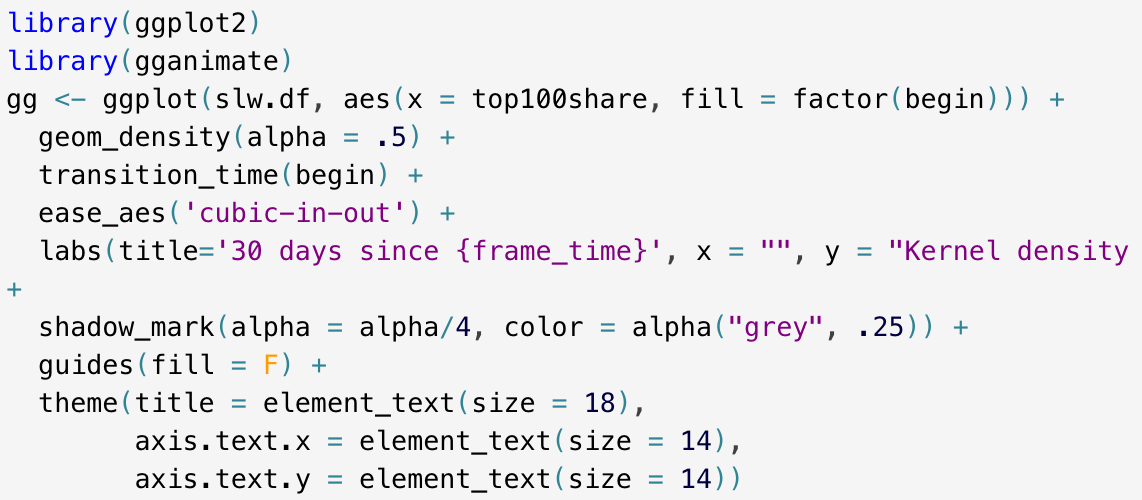
Previously, I’ve plotted a ridgeline based on a variable’s density through time. It might look nice but it’s quite obvious that time can be visualized in a more fitting way - by time itself, in an animated plot that is. So, let’s fire up the {gganimate} package again.
My goal is to show a moving kernel density curve as it moves through time, based on a moving window of 30 days sliding from the past to the present.