Predicting the video game hype train - Playing around with Naïve Bayesian Learning

tl;dr
Using a Naïve Bayesian classifier and a dataset of 1515 video game ratings, I am predicting which developer is most likely to make a game with specific properties (metascore, ESRB rating, genre, platform) in the future.
Naïve Bayesian learning
A Naïve Bayes classifier is a very simple method to predict categorial outcomes. A well-known application is text classification, especially predicting whether a text is spam. Here, the classifier tries to use the information about the occurrence of certain words in telling us whether an e-mail message is spam or not. If I understand the method correctly, it’s called “naïve” because it makes some oversimplified assumptions about the data it’s classifying, especially that all events (or values of a certain feature) are independent from each other (i.e. from the values of other features). So it’s neglecting all possible correlations between the different features. That makes the method very fast, even when there are many features used for prediction.
Of course, the method can be applied to other data than e-mails. So, I wanted to try it with the videogames dataset I’ve investigated before. The dataset is available from Kaggle. I still have to gain some experience with the methodology. If you have any suggestions on how to improve this analysis, please let me know.
Data preparation
I will restrict the dataset to developers with at least ten entries in the original dataset. Note, that these are not necessarily games because some games appear more than once because there are separate entries for the different platforms (PC, PS4, Switch, …).
library(data.table)
games <- fread("metacritic_games.csv")
dev.tab <- table(games$developer)
games <- games[games$developer %in% names(dev.tab[dev.tab >= 10]),]
# Exclude empty developers
games <- games[games$developer != "",]
# Exclude empty ESRP ratings
games <- games[games$rating != "",]
nrow(games)
## [1] 1515length(unique(games$developer))## [1] 82We are left with 1515 games from 82 developers.
The Naïve Bayesian classifier needs categorial data. I want to include the metascore into the analysis, so I am binning it:
- Metascore 0 - 60 gets the label “Aaargh!”.
- Metascore 61 - 75 gets the label “meh”.
- Metascore 76 - 85 gets the label “OK.”.
- Metascore 86 and above gets the label “OMG Hype!”.
Of course, binning can have a large influence on the results. So, if you want to try that for yourself, play around with the cut points.
games$metascore2 <- cut(games$metascore, breaks = c(0, 60, 75, 85, 100),
                        include.lowest = T,
                        labels = c("Aaargh!", "meh", "OK.", "OMG Hype!"))
knitr::kable(table(games$metascore2))| Var1 | Freq |
|---|---|
| Aaargh! | 117 |
| meh | 609 |
| OK. | 615 |
| OMG Hype! | 174 |
Creating the model
I am using the function naive_bayes() from the {naivebayes} package to train the model on all the data. Note, that I’m setting the laplace parameter to 1. I am doing this because there are empty combinations of features in the data. For example, From Software never made a sports game (and also, EA Sports never made a “OMG Hype!” game). So, this part of the probability calculations is 0 which leads to the whole term being 0 after multiplying. The Laplace correction takes care that there is at least a minimum probability (in this case, it’s one case that is being added), also for empty combinations. And who knows, maybe From Software decides to make a sports game like “Dark Souls Golf 2022” or something like that.
suppressPackageStartupMessages(library(naivebayes))

nb.model <- naive_bayes(developer ~ platform + genre + metascore2 + rating,
                        data = games, laplace = 1)
You can enter nb.model now to see the probabilities for the 2-way combinations within the data. I am sparing you this extremely large table here. You can also do plot(nb.model) to get several mosaic-style plots that visualize the combinations between the developers and all of the predictors.
Predicting new data
Now, to predict new data, we’re going to need a dataframe with values for the predicting features. For example, if we want to see, which developer is most likely to produce a hyped, M-rated role-playing game for PC, we’ll come up with the following new.data dataframe.
new.data <- data.frame(platform = "PC",
                       genre = "Role-Playing",
                       metascore2 = "OMG Hype!",
                       rating = "M")
We can now use this dataframe in the predict() function. This function (just as for linear models) takes the model - in our case the Bayes classifier - and the new data.
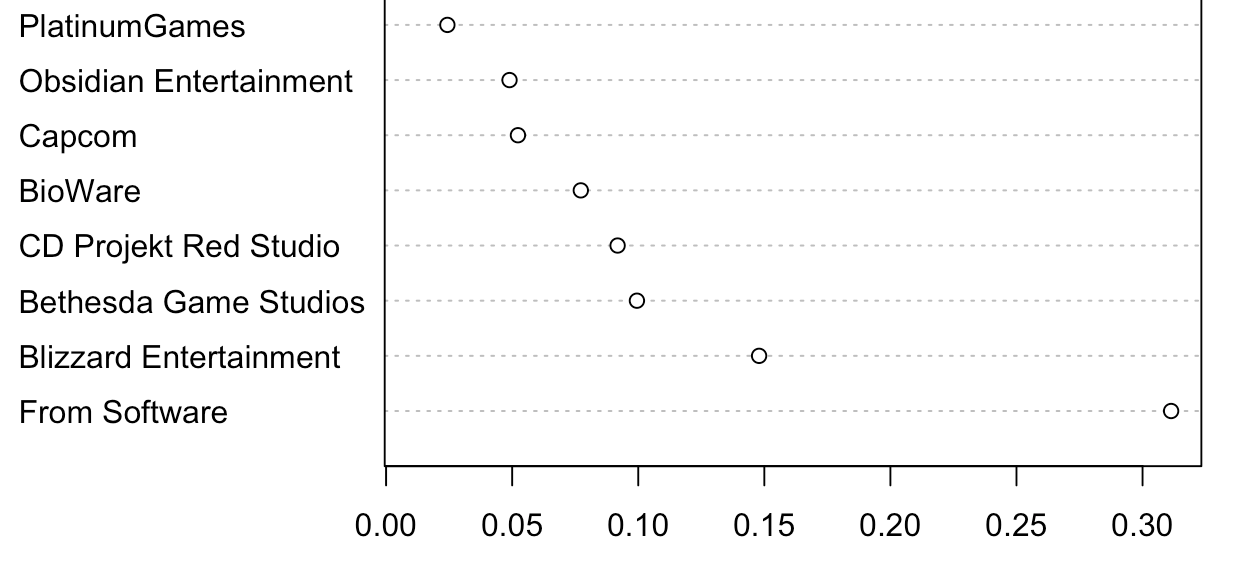
predict(nb.model, new.data)## [1] From Software
## 82 Levels: 10tons Arc System Works Arkane Studios Atlus ... Zen StudiosAs you can see, the model From Software (the makers of the acclaimed Dark Souls series) based on the new.data we supplied. We can also get the probabilities when we supply the type = "prob" argument. This returns probabilities for all of the developers that are in the dataset. We only want to see the top 3.
pred <- t(predict(nb.model, new.data, type = "prob"))
dotchart(pred[order(pred[,1], decreasing = T),][1:10])
By manipulating new.data, we can get predictions for all possible combinations. We can even leave out some of the predictors. But R will warn us about it. For example: Who’s most likely to make an OK-ish sports game?
new.data <- data.frame(genre = "Sports",
                       metascore2 = "OK.")
pred <- t(predict(nb.model, new.data, type = "prob"))
## Warning: predict.naive_bayes(): only 2 feature(s) out of 4 defined in the naive_bayes object "nb.model" are used for prediction.dotchart(pred[order(pred[,1], decreasing = T),][1:10])
And a really really good one?
new.data <- data.frame(genre = "Sports",
                       metascore2 = "OMG Hype!")
pred <- t(predict(nb.model, new.data, type = "prob"))
## Warning: predict.naive_bayes(): only 2 feature(s) out of 4 defined in the naive_bayes object "nb.model" are used for prediction.dotchart(pred[order(pred[,1], decreasing = T),][1:10])
It’s interesting to see how EA Sports, Konami and Visual Concepts are all quite likely to make a sports game. However, EA Sports is more likely to make one with a metascore within the OK. bin and Visual Concepts are more likely to make one in the OMG Hype! bin. Konami takes second place in both predictions.
How about one last test? Let’s suppose, we’ll want a really good M-rated strategy game for PC…
new.data <- data.frame(platform = "PC",
                       genre = "Strategy",
                       metascore2 = "OMG Hype!",
                       rating = "M")
pred <- t(predict(nb.model, new.data, type = "prob"))
dotchart(pred[order(pred[,1], decreasing = T),][1:10])
OK, Firaxis, let’s get going!
If you want to make your own predictions, you can download the dataset, run the code and adapt the new.data object to your liking. Let me know if you have any questions or comments.

